|
Visualisation Library
Organisations that make a commitment to the MWT Model make a commitment to communication. Developing continuous shared understanding through MWT Collaboration Architectures will optimise the organisation's management processes and creates the capabilities required to manage across organisations. As managing across organisations means requires you to explicitly define a collaboration framework in order to avoid issues with differences in work practices and cultures across organisations.
However, establishing these collaboration architectures needs to be acheived quickly. Rapid communication requires visualisation.
Example delivery roadmap
|
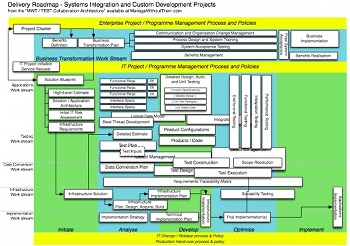
This delivery roadmap shows the activities and dependancies for custom development & systems integration delivery. It allows the entire project and all stakeholders to understand the activities which need to be performed in each phase. It also shows the mandatory project governance and supporting processes such as configuration management. Deliverables are linked on a seperate layer (not shown). |
|
Unfortunately, management can often be the art of complaining that nobody is seeing the big picture, even when there isn't one... When I look at organisations it's rare that I ever see any type of management visualisations. At best I find simplified views of how we should collaborate shown through PowerPoint clip-art and 'smart art'. These slides are rarely of any actionable value.
Even when multiple organisations are collaborating it's often assumed that this will occur automatically - or that nothing can be done proactively to reduce collaboration issues across the organisations.
So where are all the diagrams produced by managers trying to explain how everything fits together so the good folks who have to work together understand the approach?
I've come to the conclusion that these diagrams are rare because their is no real insentive to spend signigicant, quality time trying to be clear about how things fit together.
Example visualisations
The visualisations on this page are not standalone. They are part of a formal deliverable or presentation with a comprehensive narrative of each component and the scenarios in which they relate. More importantly, these are not just visualisations - they are an assimilation of the key elements of the domain produced through a systematic analysis of multiple usage scenarios and with awareness of the context (such as customer types, business processes, or the enterprise's operating model). Some are examples of the collaboration architectures described above - but others present other information such as enterprise business architectures.
Example application architecture / context
|
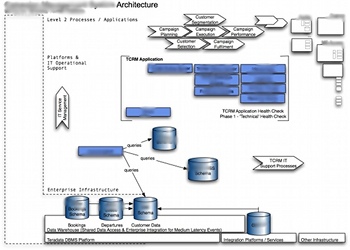
This application architecture / context shows the modules of the application, other applications interfaced through processes and / or interfaces, the individual database schemas, and usage of leveraged infrastructure. Relationships between components are not shown as they are on a seperate layer. |
|
Example team overview / context
|
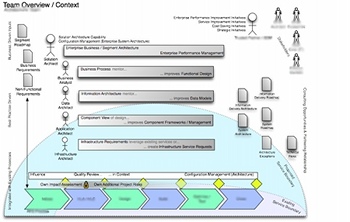
This is a generic overview of the context of an architecture team. It can be configured for other types of teams; however, in this case it shows the solution architecture, business analyst, data architect, application architect, and infrastructure architect. Importantly it also shows their responsibilities, relationship to deliverables, relationship to stakeholders, and relationship to the software development process. |
|
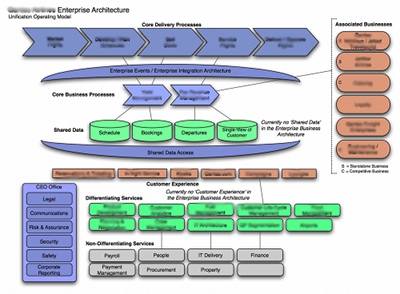
Example enterprise [business] architecture
|
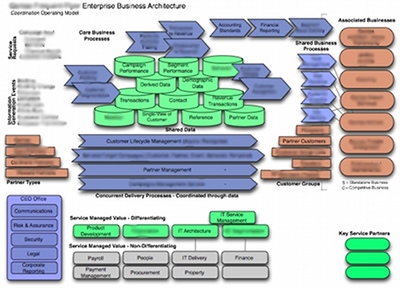
This is a generic enterprise [business] architecture. It shows the major customer types, shared data, concurrent business processes, associated businesses, and shared services. Relationships between components are shown on seperate layers for each individual business scenario. This example is specific to a 'coordination' operating model (see EA development worksheet). |
|
Example application architecture / context
|
This second enterprise [business] architecture example is for a 'unification' operating model (see EA development worksheet). It differs from the 'coordination' operating model example in that focuses on the unifying operational and business process (top of the diagram) which are characteristic of this operating model. |
|
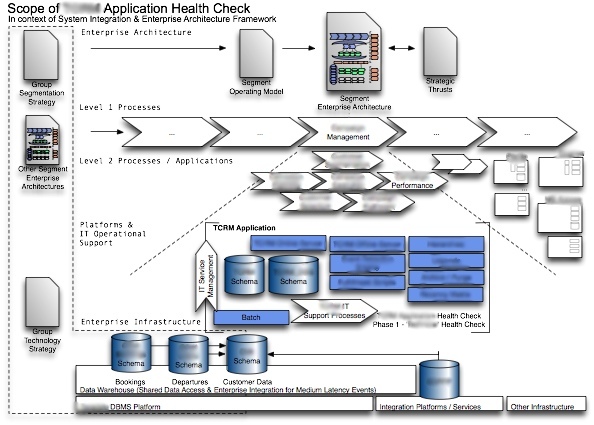
Example scope of application health check
|
The scope of an application health check is shown here. The Red/Amber/Green status of each component is not shown but appears as a seperate layer. The health check shows the status of supporting infrastructure, each application component, IT support processes, interfaces with other systems, data quality, and alignment to business processes. Additional contextual information is shown to indicate the alignment of an overall segementation strategy and the enterprise business architecture for the segment(s) that the application supports. |
|
Example relationship between deliverables (IT Transformation)
|
This 'relationship between deliverables' diagram shows the deliverables that a created or updated as part of an IT Transformation programme. It also shows processes that are created or updated as these organisational changes are also deliverables. |
|
Other visualisation examples:
- Functional Relationship Diagram (eg. testing functions)
- Relationships Between Deliverables Diagram (eg. KAFKA or phase diagrams)
- Solution Components (eg. Solution Stack or TEBT Worksheet)
- Delivery Roadmap (eg. Systems Integration and Custom Development Delivery Roadmap)
- Mentored Business Process (eg. Cycle Planning)
|